Class 4
Forays into Data Exploration
Preparation Materials
Agenda
Today we’ll focus on:
- More babynames analysis, after some:
- A bit more about IDE behavior, fixed width font, characters, and quotes
- Troubleshooting errors so far!
- p3 review/questions
- R programming basics (base R, vectors, subsetting)
How comfortable are you feeling with R and RStudio?
- super disoriented
- getting my bearings
- feeling good
- it’s like home!
Note-taking tip
Your default class project is a great place to keep some notes! They can be in any kind of text file that you can open in RStudio - .txt, .R, or if you like .qmd or .Rmd.
Misc IDE and Character Stuff
- fixed width fonts help with code readability and styling
- check out style guide linked in resources
- beware encoding and tricky special characters, especially with copy/paste, like “these”
Some notes about quotes
- single and double quotes are equivalent in R,
- except when you want to use both, they can allow for quotes in quotation if you switch between them
- generally, if something is unquoted in R, it should be an object in the accessible environment/workspace
- when you are referring to the character name of something, you use quotes
- this is all complicated by something called non-standard evaluation in R
- NSE is convenient, but confusing at first!
- this leads to some exceptions like
library(packagename) - you CAN write
library("packagename"), it’s just a shortcut to omit - most cases there is a deeper purpose to the NSE
Vectors
As you learned in the Primers, all values in R are stored as vectors. The most important thing to remember about vectors perhaps is that they can only contain one type of data - for example, all numbers or all characters.
What happens if we do this?
The basic classes or types, which can be checked with typeof() or class() are:
- double/numeric (1.2, 9.3…)
- integer (1L, 2L…)
- character (“r”, “cat”…)
- logical (TRUE, FALSE)
- complex
- raw
The semi-exception to the types constraint is with lists, but we’re going to save lists for later in the semester. They are not the same thing as lists in Python, FYI! Python lists are like R vectors.
Many functions also operate over vectors, which means that in data analysis, we seldom need to use loops. For example, let’s say we want to divide a set of numbers by 2. This can be done with a for loop:
However, in R, instead we can compute this over the vector for the same result:
Which one is easier to read?
- loop division
- vectorized division
Subsetting Vectors
We can extract (subset) values from a vector in various ways. In base R, brackets are used, and expressions are evaluated in the brackets:
#>  [1] "a" "b" "c" "d" "e" "f" "g" "h" "i" "j" "k" "l" "m" "n" "o" "p" "q" "r" "s"
#> [20] "t" "u" "v" "w" "x" "y" "z"#> [1] "a"#> [1] "a"#> [1] "a" "b" "c" "d" "e" "f" "g" "h" "i" "j"You can filter to certain values within the brackets by using expressions that will logically evaluate:
Back to babynames!
Remember to get started you need to load your libraries:
Let’s work in class on using the skills you’ve been learning to answer the following questions. You will paste the answers that you get through into your submission for your next assignment (at the bottom).
How many rows are there for a specific name of your choice before or after a certain year? For beginners, you can depend on examining the dataframe to determine number of rows. If you have prior experience and/or more time, try to write code that will actually provide the number of rows as the output.
Look at the help and examples for the
dplyrfunctionsummarize(). Use the summarize function to find the mean number (n) for a name for all years in the babynames data. (This is a harder question, and may take a lot of trial and error. HINT: you do not need to “group” for this task.)Now find the mean
nfor that name but only after the year 2000. Again, give it your best shot!Create a new dataframe that contains only the names from 2017, and use the
arrange()function to sort it with the highestnnames at the top.Filter the dataframe you just created to the names that have an
nabove 10,000 for birth certificates marked “F”.Print/show the names in that dataframe to the console (just the names, not the other columns/data). There are various ways to do this!
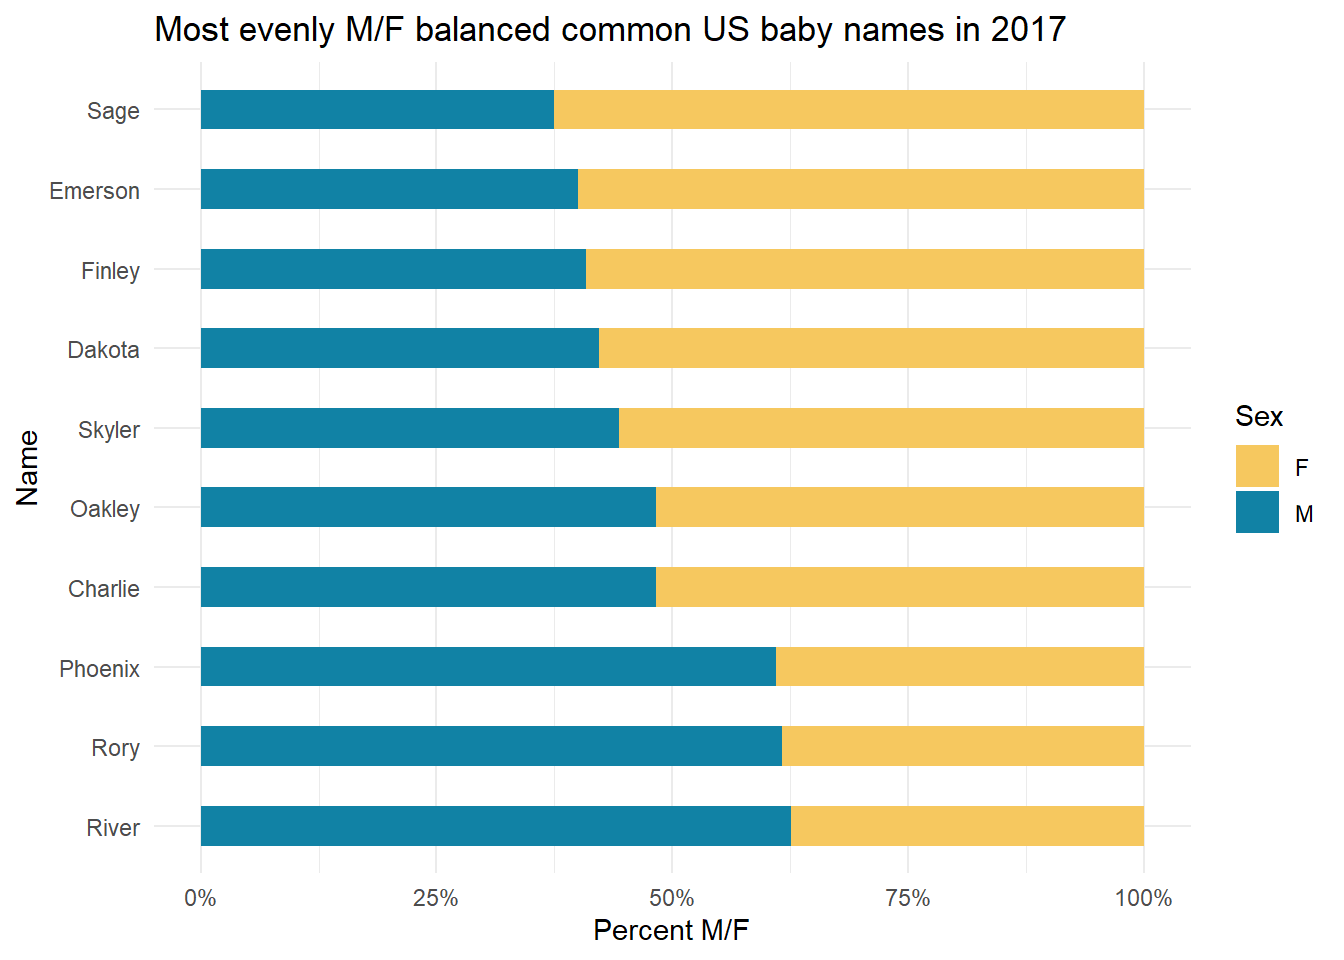
I’ll answer a more advanced question that you’ll be able to answer later in the semester - What are the most evenly split-by-sex names in 2017, of names that occur at least 500 times per sex label?
df_babies <- babynames |>
  filter(year == 2017 & n >= 500)

df_babies <- df_babies |>
  group_by(name, sex, n) |>
  count(name = "count") |>
  pivot_wider(names_from = sex, values_from = n) |>
  summarize(total = F + M,
            propF = F/total,
            propM = M/total,
            diff = propF-propM,
            absolute = abs(propF-propM)) |>
  filter(!is.na(total)) |>
  arrange(absolute)
df_babies
#> # A tibble: 34 × 6
#> name total propF propM diff absolute
#> <chr> <int> <dbl> <dbl> <dbl> <dbl>
#> 1 Charlie 3676 0.517 0.483 0.0337 0.0337
#> 2 Oakley 1263 0.517 0.483 0.0340 0.0340
#> 3 Skyler 1459 0.557 0.443 0.113 0.113
#> 4 Dakota 2330 0.578 0.422 0.155 0.155
#> 5 Finley 3143 0.591 0.409 0.183 0.183
#> 6 Emerson 3275 0.6 0.4 0.2 0.2
#> 7 Phoenix 2184 0.390 0.610 -0.220 0.220
#> 8 Rory 1388 0.383 0.617 -0.233 0.233
#> 9 Sage 1669 0.625 0.375 0.250 0.250
#> 10 River 3114 0.374 0.626 -0.251 0.251
#> # ℹ 24 more rowsdf_babies |>
slice_head(n=10) |>
pivot_longer(cols = c(propF, propM), names_to = "sex", names_prefix = "prop") |>
arrange(diff) |>
ggplot(aes(x = reorder(name, diff), y = value, fill = sex)) +
geom_bar(stat = "identity", position = "fill", width = .5) +
scale_fill_manual(values = c("#f6c85f", "#1182a5")) +
scale_y_continuous(labels = scales::percent) +
coord_flip() +
theme_minimal() +
labs(title = "Most evenly M/F balanced common US baby names in 2017", x = "Name", y = "Percent M/F", fill = "Sex")