For Homework 2, you are putting together several of the concepts we have covered into one analysis report. Working on this should be some good practice for taking the leap into your first project, so make sure to ask questions about parts you are struggling with!
Mapping with coord_quickmap()
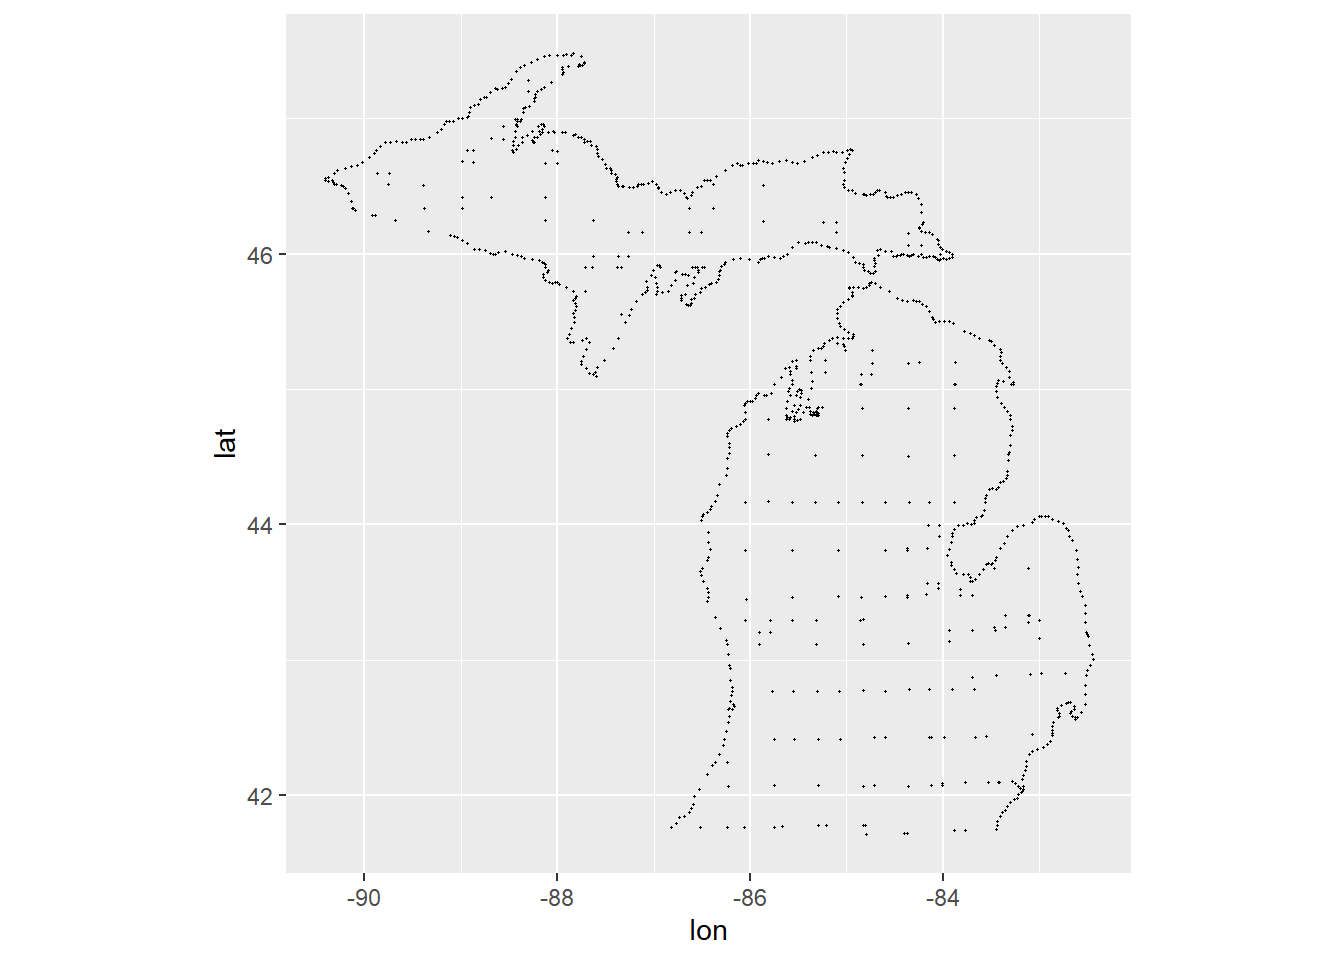
After getting your zipcodes resolved to latitude/longitude values, you can map with coord_quickmap() from ggplot2. The longitude values will be on the x-axis, and latitude on the y-axis as aesthetic mappings. Here’s an example from the ggplot2 book:
library(tidyverse)library(maps) # you will need to install this package to run examplemi_counties <-map_data("county", "michigan") |>select(lon = long, lat, group, id = subregion)ggplot(mi_counties, aes(lon, lat)) +geom_point(size = .25, show.legend =FALSE) +coord_quickmap()
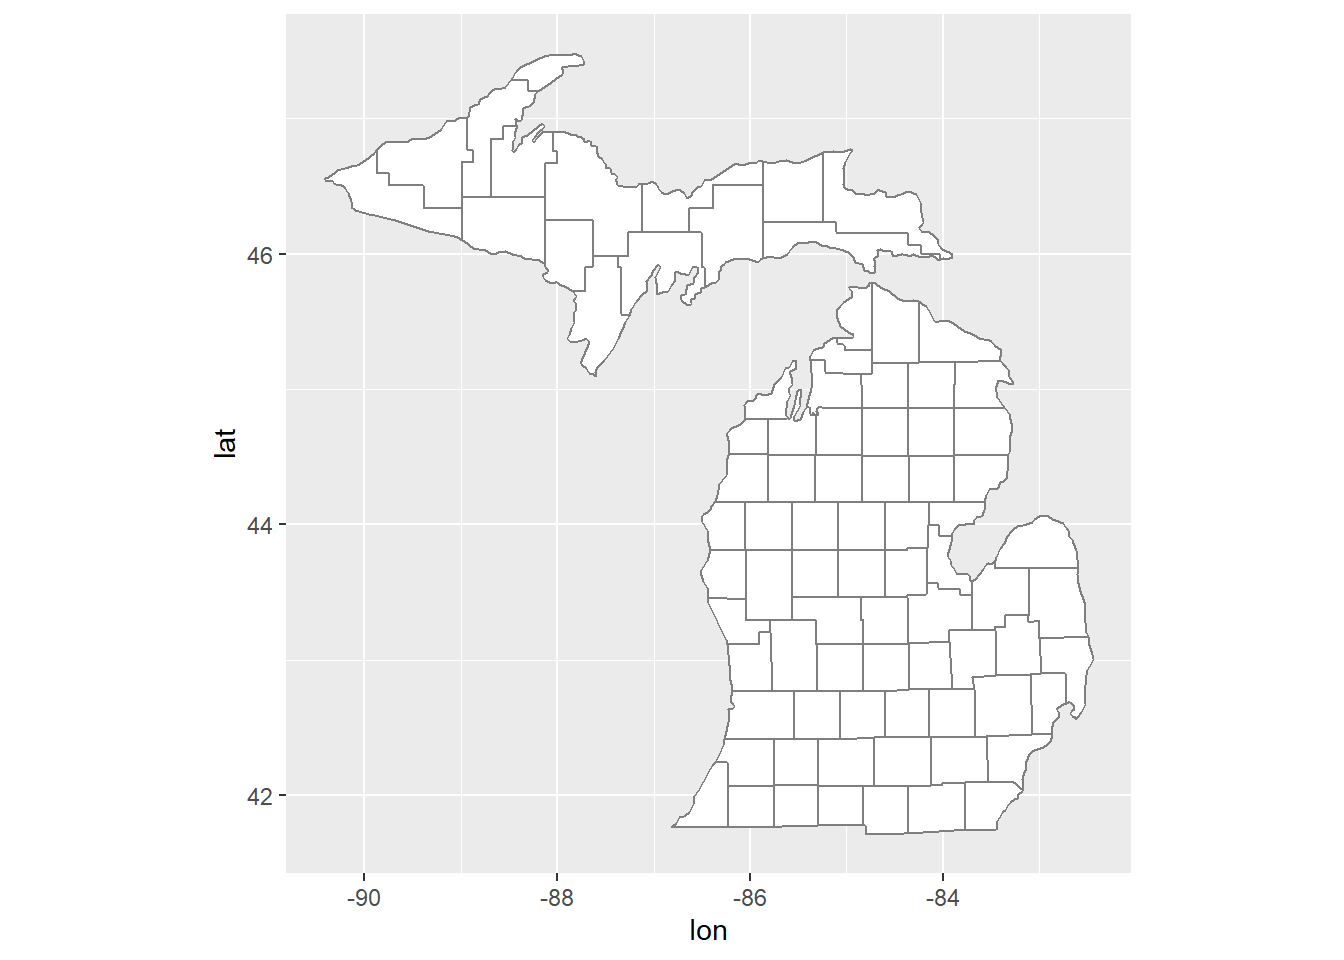
ggplot(mi_counties, aes(lon, lat, group = group)) +geom_polygon(fill ="white", colour ="grey50") +coord_quickmap()
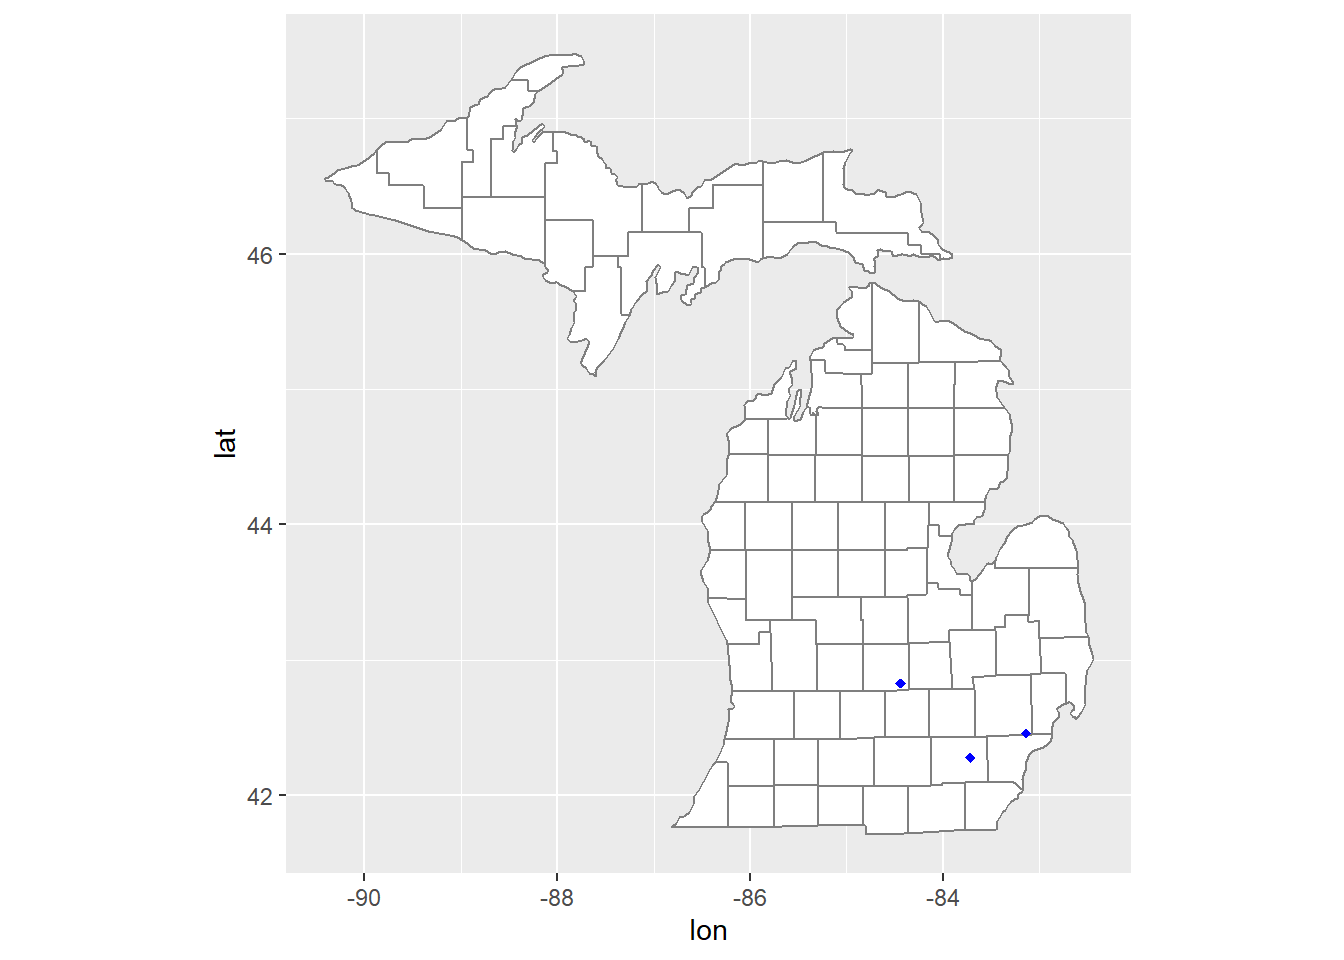
We can place a point on the map for a specific zipcode by looking up its coordinates and adding that as another layer:
library(zipcodeR)myzips <-geocode_zip(c(48109, 48220, 48808))ggplot(mi_counties) +geom_polygon(aes(lon, lat, group = group), fill ="white", colour ="grey50") +geom_point(data = myzips, aes(lng, lat), color ="blue", shape =18) +coord_quickmap()
What is Exploratory Data Analysis?
Poll
Have you heard of “p-hacking”?
yes
no
One of the best ways to understand what p-hacking is would be this xkcd webcomic, significant, resulting in this shocking news about green jelly beans:
When analyzing data for hypothesis testing, confirmatory research, or inferential statistics, there are certain constraints that must be followed to ensure the proper interpretation of the tests. One of these is limiting the number of tests or comparisons to a clearly defined set, and reporting all results of such tests.
The reason for this constraint is that statistical tests are probability-based, and if you run unlimited unreported tests, you are more likely to observe “spurious” results.
Things like “p-values” are designed for hypothesis testing. If you want to make claims about the generalizability of the data, or predictions for other data, you need to learn more about inferential statistics (which we aren’t doing here).
What we are working on here is exploring the data we have. In the practice of research, this might be done to generate new hypotheses, or on a sample data set to provide insight on testing another dataset. Exploratory analysis on a test set of data might also be reported as exploratory or post-hoc analyses. That is fine as long as it is not reported to be confirmatory hypothesis testing.
Pencil and Paper EDA Planning
The process of EDA doesn’t start in your code - it starts in the ideas and questions you have about your data.
It’s best to start thinking it through with pen(cil) and paper, a whiteboard, or a tablet drawing app - something very easy to sketch ideas on.
Questions to consider:
What do I want to check for in my data, to confirm that it is as I expect?
What do I want to learn from the data?
What kind of variables are relevant to this question?
What variables do I want to see together in one plot?
How can I distinguish between multiple variable layers/dimensions/scales?
What summaries do I need to create to answer the question?
Types of Variables
An important consideration in exploring your variables is what type of value they have. Here are some terms that are used to describe variables (these are not specific to R):
continuous: variables that can take on any value between other existing values (can be fractional)
discrete/categorical: variables that can only take certain values, such as integers or choices/types
nominal: non-continuous variables with no inherent order
ordinal: non-continuous variables that have an inherent order, but may be unevenly spaced
Poll
What would be an example of an ordinal variable from our survey data?
Poll
What would be an example of a nominal variable from our survey data?
Reviewing Examples
We’ll first look at some of the examples in the reading together (links at top).
Source Code
---title: "Class 14"subtitle: "Exploratory Data Analysis (EDA)"date: 2024-10-10date-format: "YYYY-MM-DD"image: "/images/xkcd_882_significant.png"editor: markdown: wrap: 72editor_options: chunk_output_type: console---## Further ReadingWe will be working on this material today:- {{< fa external-link >}} [Exploratory Data Analysis (R for Data Science 2e)](https://r4ds.hadley.nz/eda.html)- {{< fa external-link >}} [PsyTeachR Reproducible Research - ggplot](https://psyteachr.github.io/reprores-v3/ggplot.html)- {{< fa external-link >}} [Not All Flexibility P-Hacking Is, Young Padawan (Daniel Lakens)](http://daniellakens.blogspot.com/2021/10/not-all-flexibility-p-hacking-is-young.html)## AgendaToday we'll focus on:- Homework 2 questions/work time- exploratory data analysis vs. p-hacking- EDA visualization## Homework 2For Homework 2, you are putting together several of the concepts we havecovered into one analysis report. Working on this should be some goodpractice for taking the leap into your first project, so make sure toask questions about parts you are struggling with!### Mapping with coord_quickmap()After getting your zipcodes resolved to latitude/longitude values, youcan map with `coord_quickmap()` from `ggplot2`. The longitude valueswill be on the x-axis, and latitude on the y-axis as aesthetic mappings.Here's an example from the [ggplot2book](https://ggplot2-book.org/maps.html#sec-polygonmaps):```{r}#| warning: false#| message: falselibrary(tidyverse)library(maps) # you will need to install this package to run examplemi_counties <-map_data("county", "michigan") |>select(lon = long, lat, group, id = subregion)ggplot(mi_counties, aes(lon, lat)) +geom_point(size = .25, show.legend =FALSE) +coord_quickmap()ggplot(mi_counties, aes(lon, lat, group = group)) +geom_polygon(fill ="white", colour ="grey50") +coord_quickmap()```We can place a point on the map for a specific zipcode by looking up itscoordinates and adding that as another layer:```{r}#| warning: false#| message: falselibrary(zipcodeR)myzips <-geocode_zip(c(48109, 48220, 48808))ggplot(mi_counties) +geom_polygon(aes(lon, lat, group = group), fill ="white", colour ="grey50") +geom_point(data = myzips, aes(lng, lat), color ="blue", shape =18) +coord_quickmap()```## What is Exploratory Data Analysis?::: {.callout-note .question}#### PollHave you heard of "p-hacking"?a. yesb. no:::One of the best ways to understand what p-hacking is would be this xkcdwebcomic, [significant](https://xkcd.com/882/), resulting in thisshocking news about green jelly beans:[{fig-alt="xkcd 882 - significant"}](https://xkcd.com/882)When analyzing data for **hypothesis testing**, **confirmatoryresearch**, or **inferential statistics**, there are certain constraintsthat must be followed to ensure the proper interpretation of the tests.One of these is limiting the number of tests or comparisons to a clearlydefined set, and reporting all results of such tests.The reason for this constraint is that statistical tests areprobability-based, and if you run unlimited unreported tests, you aremore likely to observe "spurious" results.Things like "p-values" are designed for hypothesis testing. If you wantto make claims about the generalizability of the data, or predictionsfor other data, you need to learn more about inferential statistics(which we aren't doing here).What we are working on here is exploring the data we have. In thepractice of research, this might be done to **generate** new hypotheses,or on a sample data set to provide insight on testing another dataset.Exploratory analysis on a test set of data might also be reported asexploratory or post-hoc analyses. That is fine as long as it is notreported to be confirmatory hypothesis testing.## Pencil and Paper EDA PlanningThe process of EDA doesn't start in your code - it starts in the ideasand questions you have about your data.It's best to start thinking it through with pen(cil) and paper, awhiteboard, or a tablet drawing app - something very easy to sketchideas on.Questions to consider:- What do I want to check for in my data, to confirm that it is as I expect?- What do I want to learn from the data?- What kind of variables are relevant to this question?- What variables do I want to see together in one plot?- How can I distinguish between multiple variable layers/dimensions/scales?- What summaries do I need to create to answer the question?## Types of VariablesAn important consideration in exploring your variables is what type ofvalue they have. Here are some terms that are used to describe variables(these are not specific to R):- *continuous*: variables that can take on any value between other existing values (can be fractional)- *discrete/categorical*: variables that can only take certain values, such as integers or choices/types - *nominal*: non-continuous variables with no inherent order - *ordinal*: non-continuous variables that have an inherent order, but may be unevenly spaced::: {.callout-note .question}#### PollWhat would be an example of an ordinal variable from our survey data?:::::: {.callout-note .question}#### PollWhat would be an example of a nominal variable from our survey data?:::## Reviewing ExamplesWe'll first look at some of the examples in the reading together (linksat top).