What’s one feature that you find very effective in the reports you looked at?
Effective Report Ingredients
A data analysis report should be a stand-alone document that answers, or at least addresses, a specific set of questions. The reader should be able to understand it without reading other materials.
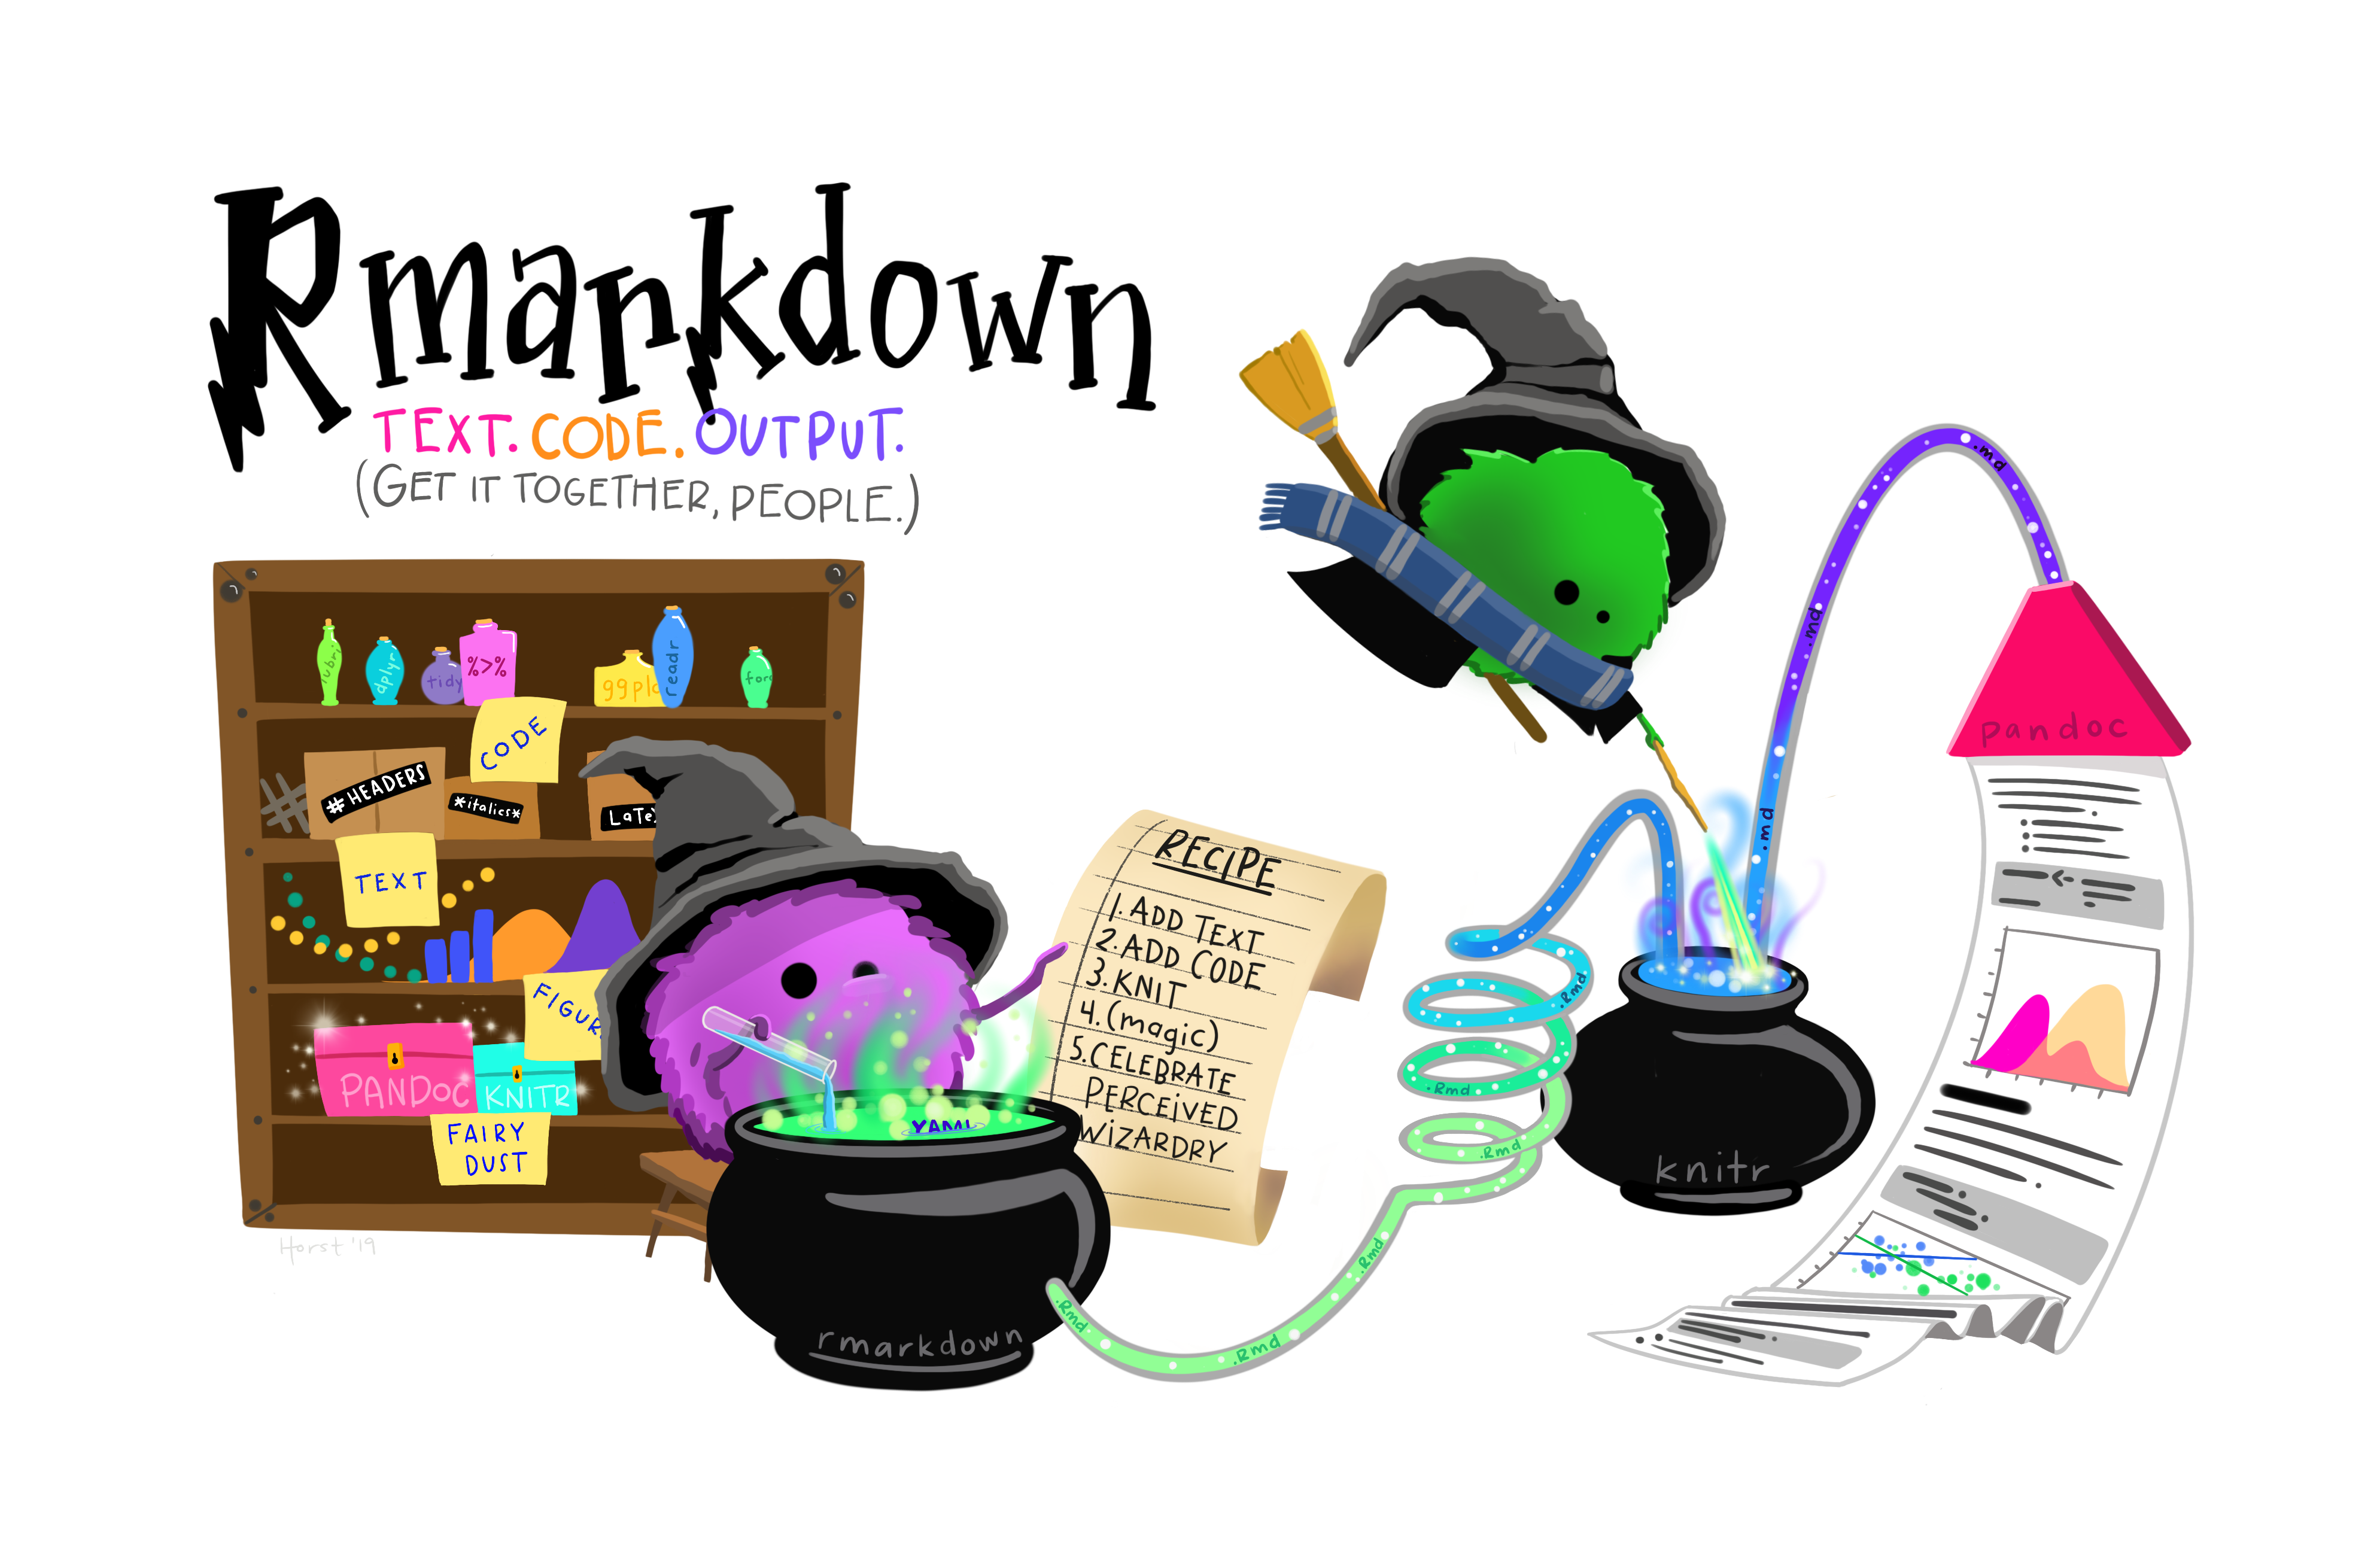
It depends on the audience how much detail you would include about how you arrived at your answers. If you are sharing a report with someone who doesn’t know R, you probably would hide all of the actual R code chunks. If you’re sharing with a fellow researcher or analyst, however, it can be very useful to show the code as well as the outputs. Code folding in html reports can give the best of both worlds. For example:
One way to check that your report is readable is to fold all of your code and see if it still makes sense! You can change all code to be hidden for your whole document by specifying echo: false in your top YAML header, as an execution option (see cell output documentation).
Everyone has a different style in what they write in the markdown text versus what they write in code comments, but if you assume code folding or code hiding, that should give some clues as to what should go where.
Given this notion of a data analysis report, an effective one will require consideration of:
the target audience (what they are looking for, what they can understand)
the goal of the report
access to high quality data
There is some variation, but generally reports should include at minimum:
an introduction/overview
a description of the relevant data and variables, their source
well-organized sections with questions/answers, like scientific paper sections:
question
methods/tests
results (clearly labelled and annotated figures and tables)
discussion (prose explanation of interpretations)
conclusions/general discussion
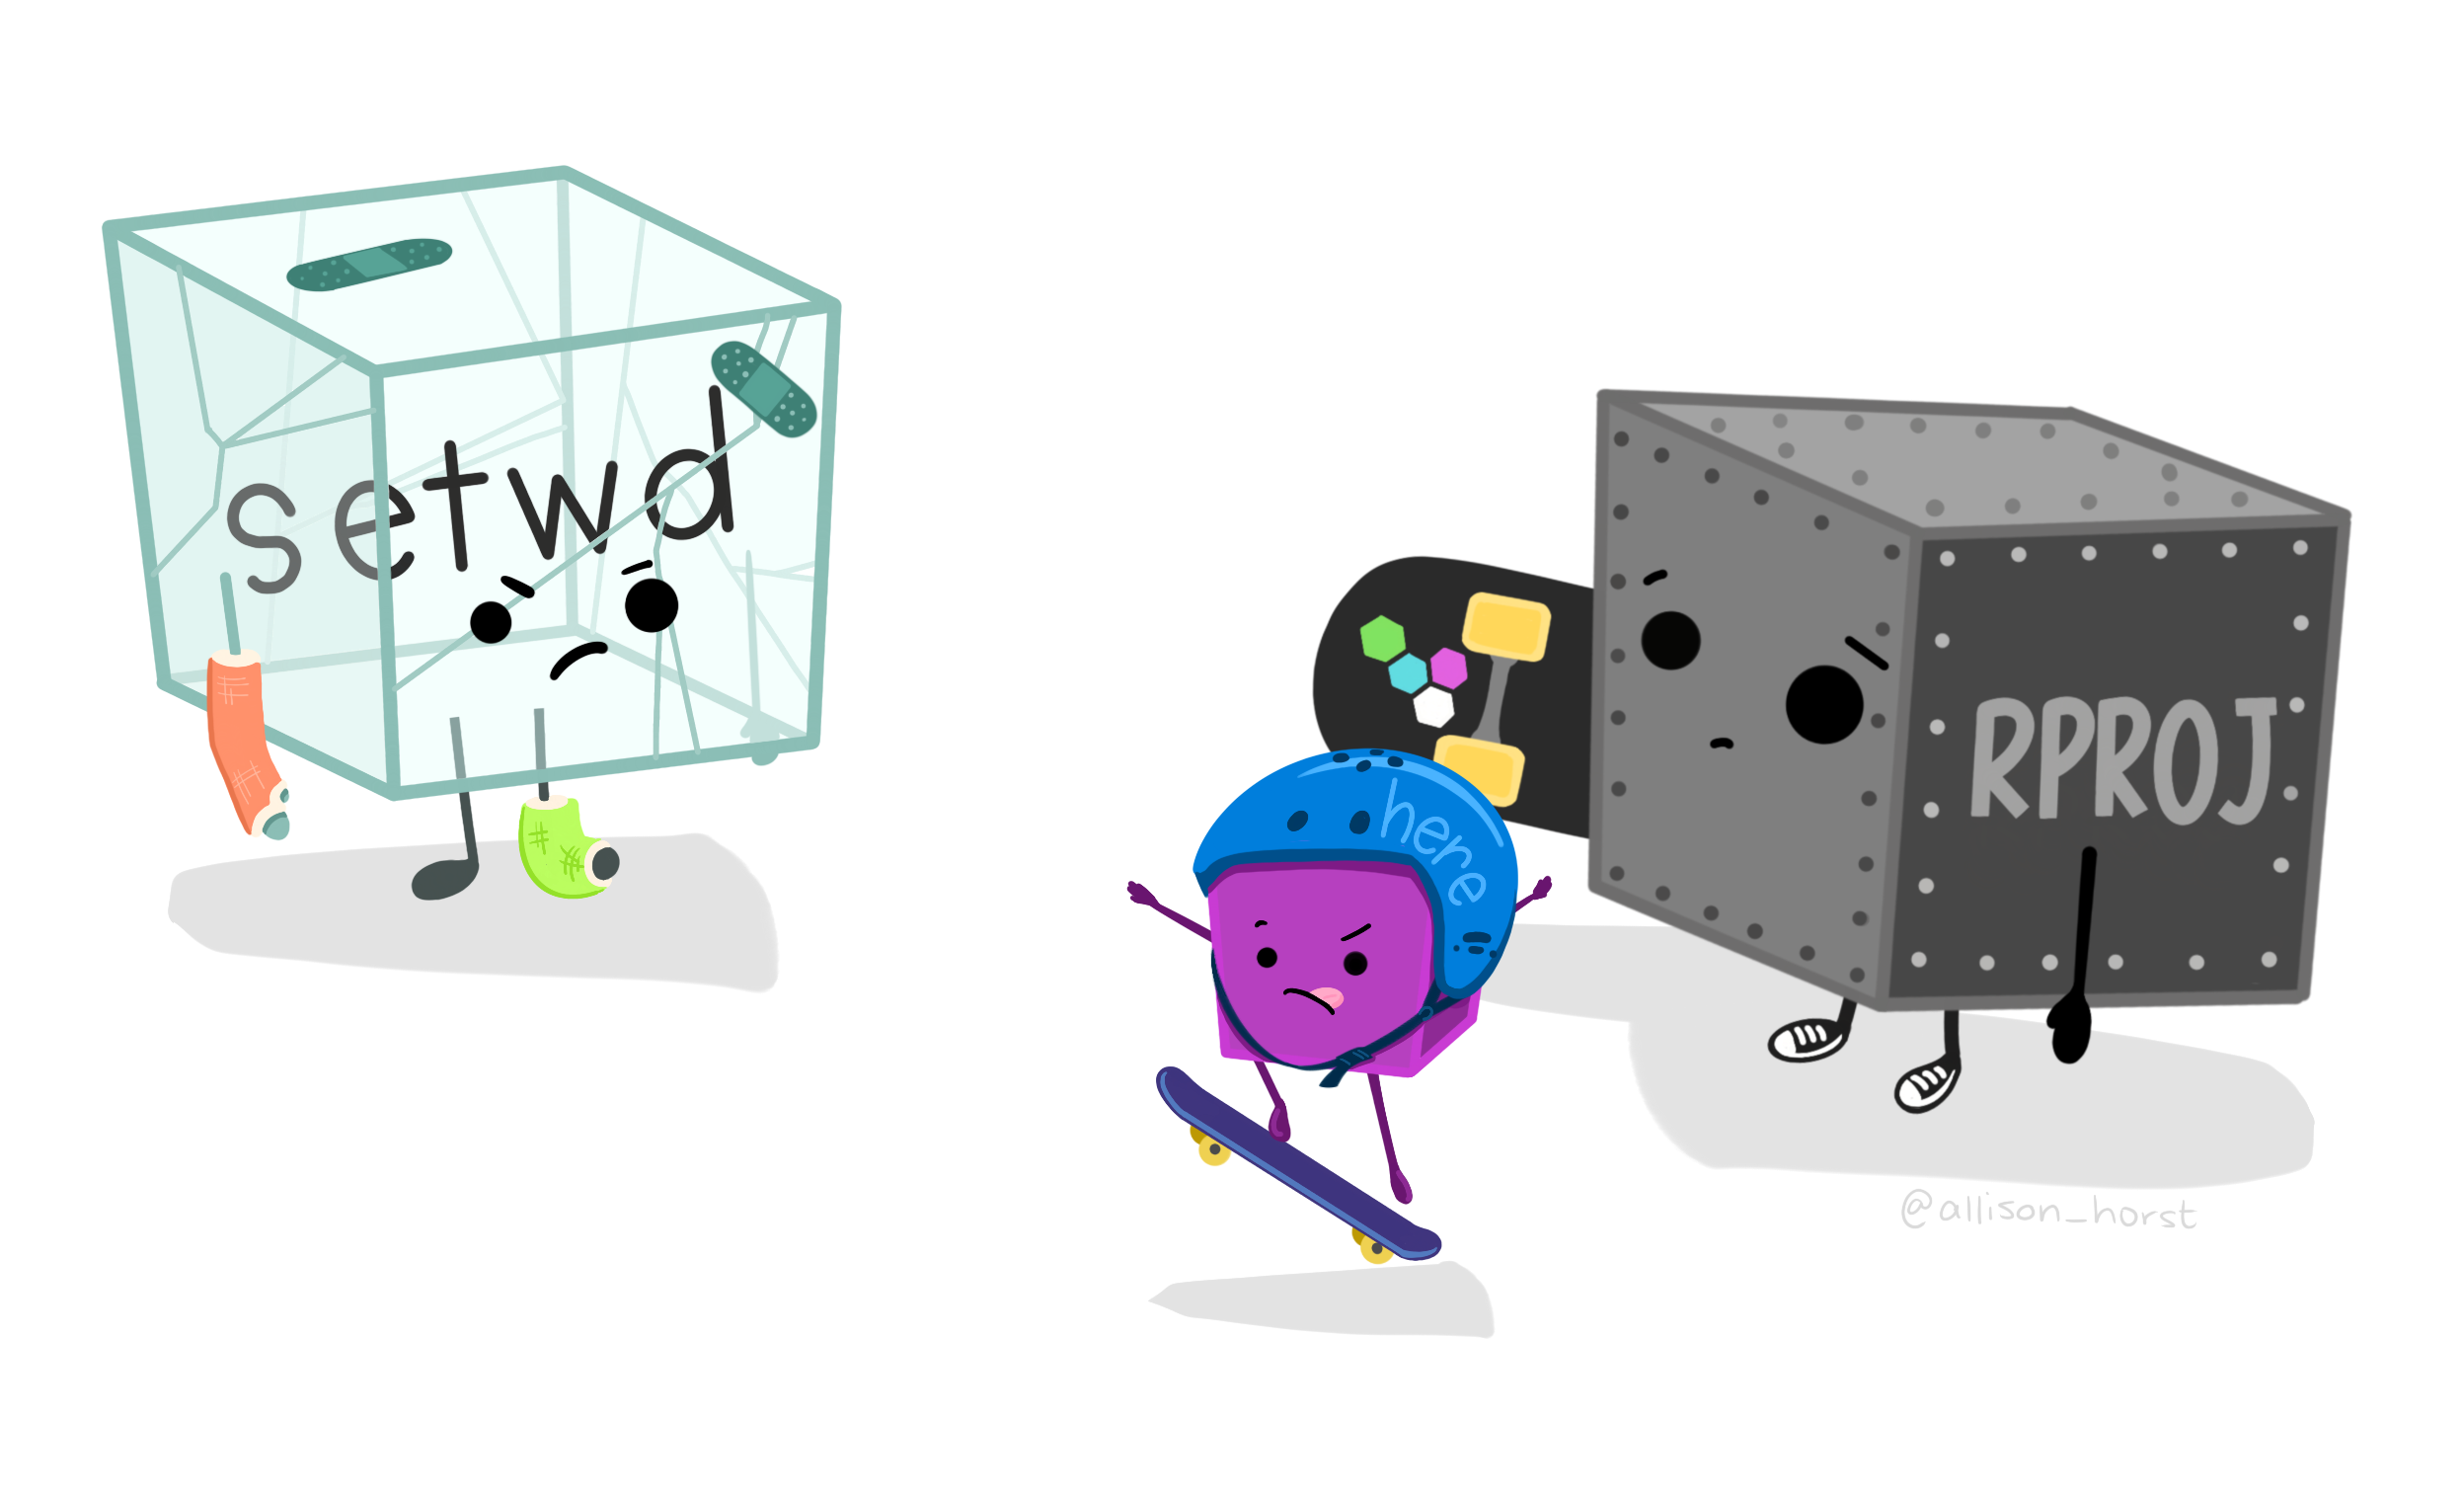
To be reproducible, a report should also include:
all packages used explicitly/visibly loaded (ideally with version numbers)
use of inline code for accurate reporting even with data changes
Then to complete the reproducibility you usually need these additional resources shared together or linked to clearly:
the runnable source code (.qmd, .Rmd, R script, etc.)
all data analyzed in a non-proprietary format
any additional functions used (sourced) not in available packages
a project or other container that contains these resources at accessible paths
properly named files/objects that work across operating systems (no spaces or special characters)
ideally, literate code (using tools like Quarto or Rmarkdown) and readable (adhering to a style guide such as the Tidyverse Style Guide)
Source Code
---title: "Class 27 (Recorded)"subtitle: "Crafting an Effective Report"date: 2024-12-03date-format: "YYYY-MM-DD"editor: markdown: wrap: 72editor_options: chunk_output_type: console---```{r}#| echo: FALSE#| include: false```## AgendaToday we'll focus on:- Sample Reports- Effective Reporting## More Sample Reports- [A Lesson in Over-preparing, Josef Fruehwald](https://jofrhwld.github.io/blog/posts/2022/12/2022-12-10/)- [Understanding mixed effects models through data simulation, Lisa M. DeBruine](https://debruine.github.io/lmem_sim/articles/paper.html)- [How old was Aragorn in regular human years?, Andrew Heiss](https://www.andrewheiss.com/blog/2023/03/21/aragorn-dunedan-numenorean-simulation/)- [Who cares about Crackdowns? Suparna Chaudhry et al](https://stats.andrewheiss.com/who-cares-about-crackdowns/experiment.html) - (analysis as website)- [Gender Roles with Text Mining and N-grams, Julia Silge](https://juliasilge.com/blog/gender-pronouns/)- [Examining the arc of 100,000 stories: a tidy analysis, David Robinson](http://varianceexplained.org/r/tidytext-plots/)- [Analysis of sentiment and emotion in Taylor Swift lyrics, Rosie (?)](https://rpubs.com/RosieB/taylorswiftlyricanalysis)- [How Many F\*\*\*s Does Tarantino Give?, Olivia Barrows et al](https://soc301s2017.netlify.app/group_projects/group4) - (swear word warning)- [Is Success Luck or Hard Work?, Albert Rapp](https://albert-rapp.de/posts/02_luck_vs_skill/02_luck_vs_skill.html)- [Six years of my Spotify playlists, June Choe](https://yjunechoe.github.io/posts/2020-07-29-six-years-of-my-spotify-playlists/)- [NBA player names in hip hop lyrics, Luis D. Verde Arregoitia](https://luisdva.github.io/rstats/NBA-rap/)- [Exploring R package startup messages, Matt Dray](https://www.rostrum.blog/2021/08/27/zzz/)- [What does a year of COVID-19 sound like?, Matt Dray](https://www.rostrum.blog/2021/02/02/sonify-covid/)- [Mapping NBA Shot Locations, David Schoch](http://archive.schochastics.net/post/mapping-nba-shot-locations/)::: {.callout-note .question}#### PollWhat's one feature that you find very effective in the reports youlooked at?:::## Effective Report IngredientsA data analysis report should be a **stand-alone** document thatanswers, or at least addresses, a specific set of questions. The readershould be able to understand it without reading other materials.It depends on the audience how much detail you would include about howyou arrived at your answers. If you are sharing a report with someonewho doesn't know R, you probably would hide all of the actual R codechunks. If you're sharing with a fellow researcher or analyst, however,it can be very useful to show the code as well as the outputs. Codefolding in html reports can give the best of both worlds. For example:```{r}#| echo: fenced#| code-fold: true#| code-summary: "Show the code"#| warning: falselibrary(ggplot2)library(hexSticker)library(palmerpenguins)flipper_hist <-ggplot(data = penguins, aes(x = flipper_length_mm)) +coord_cartesian(xlim =c(180, 226), ylim =c(0,22)) +geom_histogram(aes(fill = species), alpha =0.5, position ="identity") +scale_fill_manual(values =c("#820263","#f4f3f6","#2E294E")) +theme_void() +theme(legend.position ="none")s <-sticker(flipper_hist, package="LING 343", p_size=20, p_color ="#f4f3f6",s_x=1, s_y=.75, s_width=1, s_height=1,h_fill="#D90368", h_color="#2E294E" )plot(s)```Look familiar?One way to check that your report is readable is to fold all of yourcode and see if it still makes sense! You can change all code to be hiddenfor your whole document by specifying `echo: false` in your top YAML header,as an `execution` option (see [cell output](https://quarto.org/docs/get-started/computations/vscode.html#cell-output) documentation).Everyone has a different style in what they write in the markdown textversus what they write in code comments, but if you assume code foldingor code hiding, that should give some clues as to what should go where.[{fig-alt="Allison Horst illustration of literate programming with Rmarkdown"width="80%"}](https://allisonhorst.com/r-packages-functions)Given this notion of a data analysis report, an effective one willrequire consideration of:1. the target audience (what they are looking for, what they can understand)2. the goal of the report3. access to high quality dataThere is some variation, but generally reports should include atminimum:1. an introduction/overview2. a description of the relevant data and variables, their source3. well-organized sections with questions/answers, like scientific paper sections: - question - methods/tests - results (clearly labelled and annotated figures and tables) - discussion (prose explanation of interpretations)4. conclusions/general discussionTo be reproducible, a report should also include:- all packages used explicitly/visibly loaded (ideally with version numbers)- paths that are not based on `setwd()` or local machine file system ([don't have Jenny Bryan set your computer on fire](https://www.tidyverse.org/blog/2017/12/workflow-vs-script/))- use of inline code for accurate reporting even with data changes[{fig-alt="Allison Horst illustration of project workflow vs. setwd()"width="80%"}](https://allisonhorst.com/r-packages-functions)Then to complete the reproducibility you usually need these additionalresources shared together or linked to clearly:- the runnable source code (.qmd, .Rmd, R script, etc.)- all data analyzed in a non-proprietary format- any additional functions used (sourced) not in available packages- a project or other container that contains these resources at accessible paths- properly named files/objects that work across operating systems (no spaces or special characters)- ideally, literate code (using tools like Quarto or Rmarkdown) and readable (adhering to a style guide such as the [Tidyverse Style Guide](https://style.tidyverse.org/index.html))